Anasayfa
 Canlı Borsa
 Borsa
 Döviz Kurları
 Altın
 Hisse Senetleri
 Endeksler
 Kripto Paralar
 Döviz Hesaplama
 Döviz Çevirici
 Kredi Arama


Bitcoin returns to 200-week trend line as analyst sees risk of $57.7K next
Özet: Kripto piyasasında önemli gelişmeler yaşanıyor.
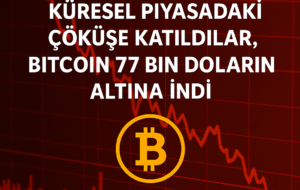
Bitcoin (BTC) fell to $67,500 on Friday, slipping below its 200-week simple moving average on its first test of the level in nearly three months.
Key points: TradingView data showed that Bitcoin last touched its 200-week simple moving average (SMA) on Aug.
The 200-week SMA has served as a reference point for Bitcoin’s cycle lows, acting as support or resistance during bear markets.
Bitcoin traded around the average from March to October 2023 and again from June to mid-August this year.
Decisive moves back above it on the weekly chart have preceded sharper rallies.
In his latest analysis, Keith Alan, cofounder of crypto trading platform Material Indicators, flagged the 200-week SMA as having confluence with a resistance/support flip level on Bitcoin’s relative strength index (RSI). Weekly RSI has returned to 41.5, a level that it established as support in late July after it spent several weeks attempting a breakout.
“Losing 41.5 on Weekly RSI opens the door to test the cycle low at $57.7k,” Alan wrote Friday on X, noting the bullish implications that successfully defending the support zone would have.
BTC price downside accelerated on Friday as Asia markets reacted to the resignation and ongoing controversy around Nvidia CEO Jensen Huang.
Hong Kong’s Hang Seng finished the day down 1.55%, while South Korea’s KOSPI Composite Index ended 0.98% lower.
Analiz: Piyasa hareketliliği devam ediyor.